"Don't follow Germany on energy policy." That was American Experiment's most recent of many, many warnings over the years, about copying the German move towards 100 percent renewable or clean power.
That is the bad news. The worse news is that Germany effectively banned the cleanest of electricity generation sources. Clean from a CO2 perspective. That being nuclear. All existing plants.
Context
"It was a serious strategic mistake to exit nuclear energy," admitted Friedrich Merz, the Chancellor of Germany, on January 15 of this year. He added that: "We set ourselves a goal that we now have to correct, but we simply don't have enough energy generation capacity."
Advertisement
"We're now making the most expensive energy transition in the entire world," said Chancellor Merz. "I don't know of a second country that makes it as difficult and as expensive for itself as Germany does." The last three of Germany's nuclear reactors were shut down in April 2023.
Merz's long-ruling Christian Democratic Union first decided to phase out nuclear energy in 1998, reversed it in 2009, and then aggressively reinstituted it in 2011 in the wake of Fukushima. Four reactors were closed between 1998 and 2009, and a whopping fifteen since 2011.
Policies
The worldview that drove this, according to the World Nuclear Association, is Energiewende. That being the transition of electricity generation, from mostly fossil fuels and nuclear, to so-called renewables. Clean Energy Wire documents the timeline from 1973 to 2020.
Notable Energiewende milestones from the 20th century were: (1973) anti-nuclear movement born with the slogan of "Atomkraft? Nein danke!"; (1979) Green Party founded to replace nuclear with renewables; (1986) Chernobyl disaster and Der Spiegel's cover story on global warming.
Key Energiewende milestones from the 21st century were: (2000) Renewable Energy Act passed and "nuclear consensus" reached to phase out by 2022; (2010) "nuclear consensus" reversed; (2011) "nuclear consensus" restored; (2018) Coal Exit Path; and (2019) Climate Action Law passed.
Consequences
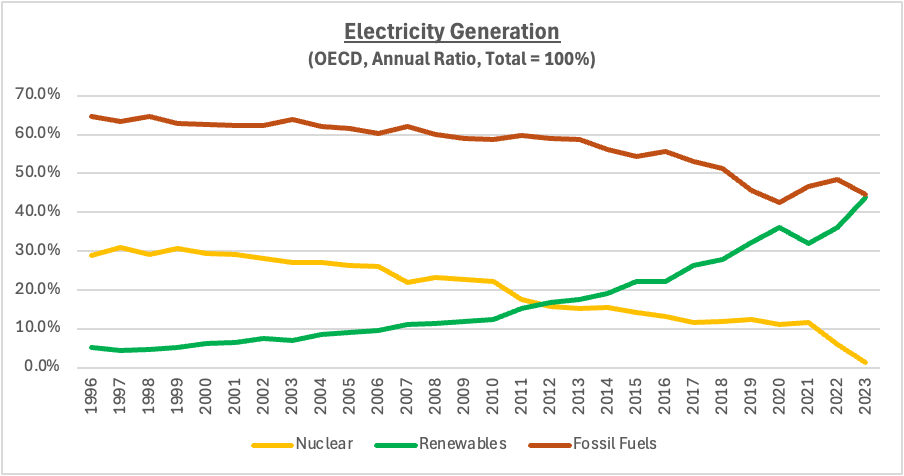
The first chart shows the declines in the electricity generation source ratios of both fossil fuels and nuclear as well as the rise of renewables. The nuclear ratio is significantly reduced from 30% in 1996 to 20% in 2010. It then falls to 10% in 2021 and collapses to 0% in 2023.
Advertisement
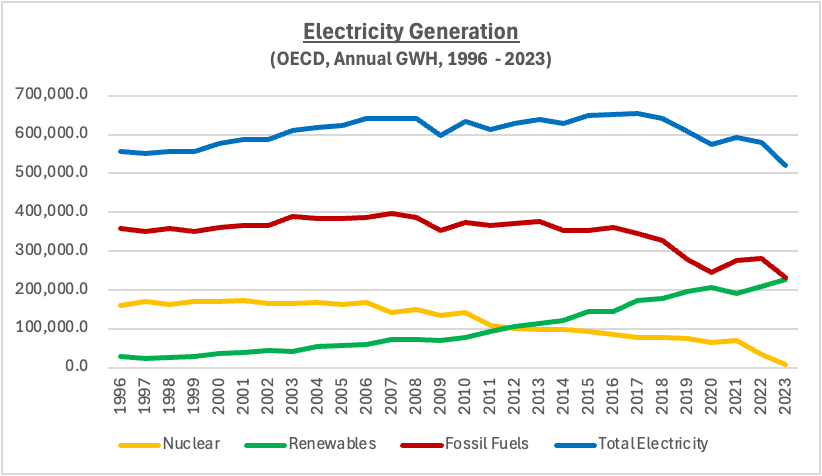
The second chart tracks electricity generation in total output as well as for nuclear, fossil fuels and renewables. Renewables overtake nuclear from 2012 and dramatically diverge in oppo`site directions onwards. Total electricity supply has consistently been in decline since 2017.
Discuss in our Forums
See what other readers are saying about this article!
Click here to read & post comments.




 reddit this
 Del.icio.us
 Seed Newsvine
 StumbleUpon


