On Wednesday 6 March, the Australian Bureau of Statistics released the Australian GDP numbers for the December quarter of 2018. These accounts showed year on year growth rate of GDP in trend terms as 2.3%. They also showed GDP growth in seasonally adjusted terms of 2.3%. In any other developed economy, these would be regarded as good numbers.
Nevertheless, some commentators have suggested that Australia is in a “per capita recession”. This is because in seasonally adjusted terms, GDP per capita fell slightly in the September quarter and the December quarter. This did not happen in the more reliable trend measure of GDP. In this measure, GDP per capita rose in the September quarter, but fell in the December quarter (see footnote).
Right there, we can see the two negative quarters of GDP in both the September and the December quarters are probably just because the seasonally adjusted numbers have more random variation in them, than the more reliable trend measures.
Advertisement
What we want to discuss here though, is the broader issue of how to interpret the Australian GDP numbers. The real GDP numbers published by the ABS are regularly taken to be an accurate estimate of what is happening in the Australian economy.
The problem for most of us is that they have almost nothing to do with the economy as we experience it. These real GDP numbers frequently tell us that the economy is in good shape, when everything around us tells us that it is rotten. These numbers may also tell us that the economy is in bad shape, when everything around us tells us, that it is really good.
How does this happen? We can begin our investigation by looking at the chart below. Here we see the year on year rate of change of Australian GDP, in Australian dollar terms. We also see the year on year rate of change of Australian GDP, in terms of the real GDP numbers published by the ABS. For most of us, the economy that we experience is not the economy “in real terms”. The economy that we experience is the economy in Australian dollar terms. When we are paid, we are paid in Australian dollars. When we pay taxes, we pay taxes in Australian dollars. When the government receives tax revenue, it receives it in Australian dollars. When Australian companies make profits, those profits are published in Australian dollars.
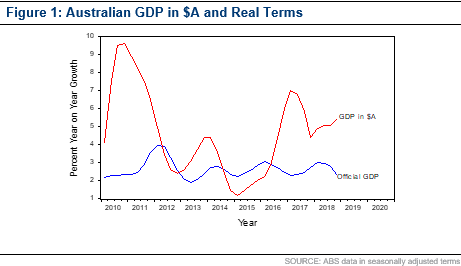
In Figure 1 above, we can see why the growth rate of the Australian economy has appeared to the ordinary citizen to swing around so much since the beginning of this decade. Back when were still in the commodity boom in 2010, GDP in Australian dollar terms rose rapidly, but the GDP in real terms, as published by the ABS told us that the Australian economy was pretty much the same as it is right now. GDP growth in real terms was 2.34% for the year to Q4 2010 when there was a boom and 2.27% for the year to Q4 2018 when the economy is what it is today.
The difference may have been that in the year to Q4 2010, nominal GDP growth or GDP growth in Australian dollar terms, rose by 9.64%. On the other hand, for the year to Q4 2018, nominal GDP growth or growth in Australian dollar terms, rose by 5.5%.
Advertisement
Another time, when real GDP as published by the ABS as the same as now, was the year to Q4 2014. Back then, real GDP was published at 2.36%. This was almost the exact same number as in Q4 2010 and Q4 2018. Yet the Australian economy at that time was absolutely rotten. Wages growth had fallen dramatically and unemployment had gone up sharply. At that time, for the year to Q4 2014, nominal GDP growth was only 1.5%. It fell to 1.2% for the year to Q1 2015.
What this tells us, is that nominal GDP, or GDP in Australian dollar terms, tells us much more about how we actually experience the economy, than GDP “in real terms”, as published by the ABS.
Why is the ABS real number so misleading?
The problem with the lack of ordinary utility in the ABS number for real GDP, lies in the way the GDP deflator is calculated, and how it is used in the Australian context. Back in the 1980s, Australia became part of an international convention to move from the National Accounts done as Gross National Product, or GNP to Gross Domestic Product, or GDP.
This article was first published by Morgans.
The information contained in this report is provided to you by Morgans Financial Limited as general advice only, and is made without consideration of an individual’s relevant personal circumstances. Morgans Financial Limited ABN 49 010 669 726, its related bodies corporate, directors and officers, employees, authorised representatives and agents (“Morgans”) do not accept any liability for any loss or damage arising from or in connection with any action taken or not taken on the basis of information contained in this report, or for any errors or omissions contained within. It is recommended that any persons who wish to act upon this report consult with their Morgans investment adviser before doing so. Those acting upon such information without advice do so entirely at their own risk.
This report was prepared as private communication to clients of Morgans and is not intended for public circulation, publication or for use by any third party. The contents of this report may not be reproduced in whole or in part without the prior written consent of Morgans. While this report is based on information from sources which Morgans believes are reliable, its accuracy and completeness cannot be guaranteed. Any opinions expressed reflect Morgans judgement at this date and are subject to change. Morgans is under no obligation to provide revised assessments in the event of changed circumstances. This report does not constitute an offer or invitation to purchase any securities and should not be relied upon in connection with any contract or commitment whatsoever.
Discuss in our Forums
See what other readers are saying about this article!
Click here to read & post comments.
4 posts so far.

 reddit this
 Seed Newsvine
 StumbleUpon
