Recent discussions about the CPI have brushed over a key change that occurred in the construction of the index in 1998. In its 13th Series the CPI became a pure price index utilising an acquisitions approach, rather than a cost-of-living index utilising an outlays approach. One feature of this change is that it removed land costs for owner-occupiers – something which doesn’t appear to reflect reality and provides some intriguing results.
The move to an acquisitions approach was in line with the broader philosophy of inflation measurement at the time. The OECD noted this philosophical change, commenting that modern inflation indexes:
…have been constructed with the aim of measuring monetary inflation rather than measuring the broader concept of the cost-of-living, which has a more welfare-oriented philosophy.
Advertisement
The ability to judge economic conditions with any degree of confidence is best achieved with both a cost-of-living index and a pure price index. Since 2003 the ABS has published its Analytical Living Cost Indexes for households (ALCI) to play the role of a cost-of-living index. This measure uses the outlays approach, and one would expect it could reveal some of the costs associated with the land price boom of the early 2000s.
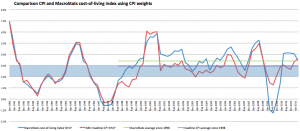
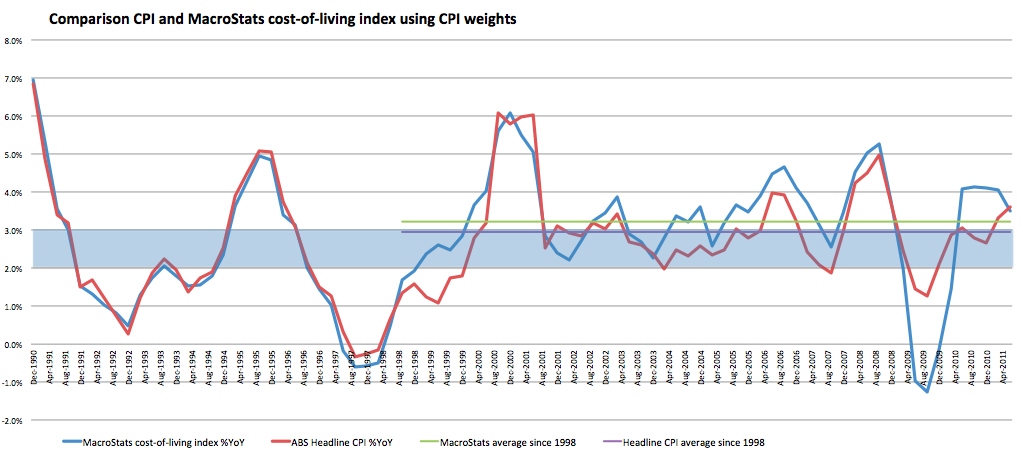
Yet the ACLI for employees is within 3% of the CPI after thirteen years. I can reconcile this outcome fairly closely with my own calculations using their method, and estimate a cost-of-living index around 0.3 percentage points higher than the CPI, on average, over the past 13 years. You will notice how this index tracks the CPI prior to 1998 (this method actually was the CPI calculation at that time). The graph is below.
However it is a little strange that the ABS conducted an evaluation of the impact of different treatments for housing in the CPI back in 2006 and found that a full cost-of-use approach, with weighting consistent with HES data (which the CPI does not have), would have produced a CPI between 1998 and 2003 more than double the official number (for Sydney). Considering that the official ALCIs were slightly lower than the CPI over this period, it is an odd situation indeed.
The reason for the discrepancy can be traced to a gap in the mortgage interest charge index between 1998, when it was removed from the CPI, and 2003, when it was added as a separate item in the ALCIs. The ABS cannot provide the data to bridge this series gap, and has suggested that simple interpolation is innappropriate due to rebasing of the ACLIs during this time.
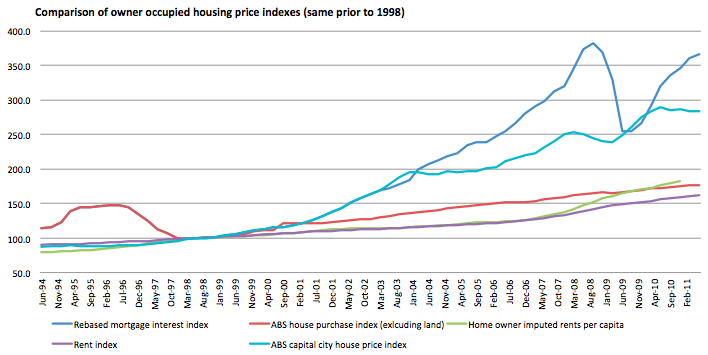
Below is a graph of the mortgage cost index rebased as per the ABS explanation and interpolated using the data on mortgage interest paid as a proportion of household income from the RBA. This mortgage interest charge index can be compared to the ABS house price index (HPI) from 1994. We can see that from 1998-2003 the HPI increased 64% while the mortgage interest charge index increased just 24%. Yet the mortgage rate was the same at the beginning and end of the period. We also know that the HPI was originally developed as an input to the mortgage interest charge index. It is this data which gives a cost-of-living estimate matching the published ACLIs.
Advertisement
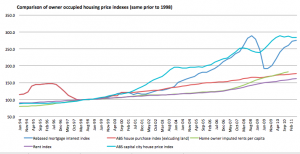
But a more realistic reconciliation of the mortgage interest charge index would have this index tracking the HPI during the 1998-2003 period as shown in the graph below.

Using this data the cost-of-living index is about 0.5 percentage points higher on average since 1998.
So what led to the current mysterious situation surrounding housing treatment in cost-of-living indexes, and the complete removal of land from the CPI?
In 1997 the RBA argued strongly to remove the price of land from the CPI in its submission to the 13th Series CPI review. The RBA argued that including a mortgage interest component in the CPI would result in an inflation measure that is amplified by monetary policy responses to inflation itself. They say -
At a time when inflationary pressures are increasing, interest rates are being increased to combat those pressures. The interest components of the CPI also rise, adding a short-term impulse to inflation as measured by the headline (or total) CPI.
That is a reasonable argument in my mind. But their logic for me breaks down a little when they say that the acquisition of a house is really an investment activity, rather than consumption.
So why include it at all? Why not use an imputed rent for owner-occupiers to be consistent? Or use mortgage interest as a proxy for the annual benefits flowing from owner-occupied housing? Simply excluding land purchase costs without any proxy for the annual use of land is totally inconsistent.
To me you need to choose one treatment or the other. Either add the full cost of home ownership as a lump sum, either in the form of house prices, or add the cost as a periodic payment by the home-owning household to itself in the form of imputed rents. The RBA canvasses this approach in its submission but noted that this may cause a ‘disproportionately large’ weight to the housing basket.
The weight to be assigned to the Housing group would need to be adjusted to recognise that all owner-occupier households are paying ‘imputed’ rents to themselves, resulting in a disproportionately large weight on housing in the CPI.
The RBA submission mentions a number of times that they see a high weight on housing in the CPI basket as unfavourable. For example they note that by excluding the land component of house purchases the weight on housing would be substantially reduced. By international standards our basket weight to housing is low at 16.43%. Germany has a 20.33% weighting for rents alone (and another 1.4% for home maintenance), the US has 30% allocated to rents and owner-occupied imputed rents, the UK has housing at 20.9% and the Netherlands at 23%.
This is all very odd since the weighting of housing in the CPI is a key determinant of the CPI itself. The ABS noted this issue in their 2006 analysis, showing that the full weight of household expenditure on owner-occupier user costs was around 15.8% in 2003, yet the CPI measure allocated just 7.1% to owner-occupied housing costs.
Most interesting of all is that the RBA concludes in their submission that excluding interest charges would in no way distort the outcome over the long run. Well, I’m not sure just how long the long run was in the minds of the RBA staff at the time, but they probably weren’t thinking about periods longer than a decade. The mortgage interest charge line in the third graph above may very well return to the level of the current house purchase cost line. But as you can see, for this RBA assertion to hold true, home prices or interest rates need to fall quite a way.
Quality adjustments to the rent price index are another strange feature of the treatment of housing in CPI. The scope of quality adjustments to rental price index has lead to this absurd result:
…that for the period December 1994 to December 2005 the average rent paid by private tenants included in the ABS Survey of Income and Housing increased by 41.1%, while the increase in the CPI rental component was 22.9%
As I said last week, it is about time that the silent quality adjustments creeping into the CPI be made public so we can better evaluate just what this means out there in real life.
For some reason the RBA doesn’t seem too bothered by changes in the CPI methodology, particularly relating to the price of housing.
Currently, housing-related costs – including rents, utilities and the cost of building new dwellings – account for around 20 per cent of the CPI, the largest share of any single group. Broadly speaking, the housing component of the CPI shows the same general pattern as that in underlying inflation, although the recent moderation is less pronounced.
The bank also has a particularly strange argument to explain why high house price inflation is not a concern. They state that the large run-up in Australian house prices that was driven by the adjustment to low inflation ended in late 2003. Yet inflation in the 1990s was around 2.1% on average, and increased quite dramatically from 1998 to 2003 during the run-up in house prices. Of course, the RBA doesn’t use headline inflation measures anyway. They have their own favourite price measure – the average of the weighted median and trimmed mean CPI.
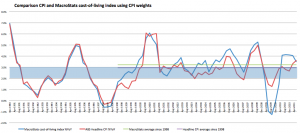
So where does that leave us? We can combine the main areas where housing has been stricken from the CPI – the removal of mortgage costs, quality adjustments to rent, and reduction in weight to home ownership costs – to see what difference it would make had the pre-1998 methodology been continued. The resulting MacroStats cost-of-living index is plotted below against the headline CPI.
This measure uses a continuous weighting adjustment between weight revision years (1998, 2000, and 2005), and applies a weight to owner-occupied housing costs consistent with the weighting in the ABS 2006 publication on housing in the CPI as well as applying the amended mortgage cost index in lieu of the new house purchase index. It also makes a slight adjustment to the rent price index since 1990 (20% increase in growth rate compared to the almost 100% increase observed using mean measures) to remove a little of the quality adjustment.
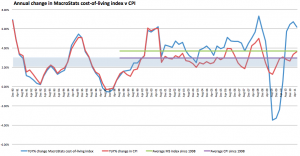
We can again see how this measure tracks the official CPI very closely until 1998. Since 1998 it is 0.73 percentage points higher on average (or 3.8%), and in the period 2001-2008, it averaged 1.3 percentage points higher (or 4.4%pa). That gives you some idea of how significant the 1998 methodological shift in the CPI was in disguising housing inflation and creating a feedback loop with lower monetary policy.
So what does this all mean? For me there are four key lessons.
1. The treatment of housing needs to be consistent in a pure price index with its treatment of a flow of services. You can’t include a capital cost in the form of new house purchases without including land, but also include a cost-of-service price for rental homes. My recommendation is to treat owner-occupied housing in the form of imputed rents with a weight in the basket approximating the weight to mortgage payments.
2. If home ownership is a policy goal, cost of living indexes should treat home buying and renting households separately. This will ensure that any policy aimed at making home owning more attractive can be evaluated by comparing these metrics.
3. In all both pure price and cost-of-living indexes quality adjustments, particularly regarding heavily weighted items such as rent, need thorough explanation and should be published alongside standardised measures such as mean and median prices.
4. Be extremely careful comparing economic performance between time periods using the CPI to deflate nominal price to real prices.


 reddit this
 Seed Newsvine
 StumbleUpon
