Early in the year, I was puzzled over what was happening in the LNG market because LNG was behaving in a completely different way than oil. Brent oil and West Texas intermediate grade are two things that I have been modeling for many years. The conclusion I came to was that LNG was having to compete with other potential fuel sources in the electricity generation market in areas of the very, very rapid growth of electricity demand. That was particularly true in the Indo-Pacific.
I found that what was happening with the LNG market was not really about the shortage of gas in Germany or because of the Ukrainian war. It was really the extensive growth in electricity demand both for coal and for natural gas in the Indo-Pacific, and particularly the extraordinarily robust growth in India.
I will just provide some rough numbers as to how these energy sources compete. Normal coal, say, Indonesian coal produces at about 20 million BTU per tonne. Australian coal is better than that or about 30 million BTU per tonne. Oil produces about 40 million BTU per tonne. Natural gas, which is the most powerful of all these commercial fuels, produces about 52 million BTU per tonne.
Advertisement
So, if you are interested in carbon emissions, a tonne of each of those generates about 2.8 tonnes of CO2. When you want to minimise CO2 production, firstly you select LNG. Secondly, you go to oil. Thirdly, you go to Australian coal and only, last of all, you go to Indonesian coal.
That is important because Indonesian coal is the largest volume supplier in the market. When I wanted to build a model of this, I have these various components in the model. After reading the July issue of the International Energy Agency Coal Report, I came to the view that we were having an enormous increase in coal demand in India. This was pushing up the price of coal which was interacting with the price of LNG.
The data in the July report was that in 2021 India, for the first time, burnt over 1.05 billion tonnes of coal, and three-quarters of that was for electricity. The increase in the demand for that was an amazing 12% or 117 million tonnes increase in 2021 alone. India had increased its demand for coal for that year because of its electricity demand. That was followed up this year by a 9% increase in coal-fired demand in India in the first half of 2022. This was followed by 7% in the second half.
After an extraordinarily strong increase in demand for coal in India for electricity generation in 2021, we were following up with something which was as strong this year. Both sources of energy were competing in a world in which Europe was trying to get more coal to replace the Russian natural gas that it had lost. The first thing this did was generate an enormous premium for Australian coal because of its higher energy level, and in turn, generated an even stronger upward pressure on LNG. So, the combination was that Australian coal and LNG were being forced up much higher than the normal long-term prices. This was so extraordinary. Those prices were rising dramatically, relative to the price of oil which I had been used to in my modeling. Our model of LNG based on those components is shown in Figure 1 below.
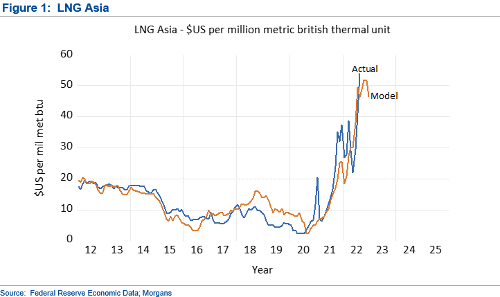
Currently, the model explains about 76% of the monthly variation of the monthly LNG price. The LNG price that I am showing is an IMF measure that is based on exports of Indonesian LNG to Japan. The most recent published price was $US54 per million BTUs. That is about five times the price that it was a year ago. The model estimate goes forward between $US52 and $US47. The model estimate goes sideways at these very, very high levels and that price continues as far as the model can see, which is a few months ahead of where we are right now.
Advertisement
So, what you have is the view of the model. It is not just what is happening in Europe. It is not just what is happening in Ukraine or what Russia is doing. It is that this is happening at the same time as you. You have extraordinarily strong structural demand for energy because of the electrification of the Indo-Pacific. Those things moving together at the same time have driven up the price of Australian coal and driven up Australian LNG. Those factors are not going away.
We continue to have robust growth in electricity demand in the Indo-Pacific. We have staunch support for these prices remaining through the year.
I will update this model again through the year.
The information contained in this report is provided to you by Morgans Financial Limited as general advice only and is made without consideration of an individual's relevant personal circumstances. Morgans Financial Limited ABN 49 010 669 726, its related bodies corporate, directors and officers, employees, authorised representatives and agents ("Morgans") do not accept any liability for any loss or damage arising from or in connection with any action taken or not taken on the basis of information contained in this report, or for any errors or omissions contained within. It is recommended that any persons who wish to act upon this report consult with their Morgans investment adviser before doing so. Those acting upon such information without advice do so entirely at their own risk.
This report was prepared as private communication to clients of Morgans and is not intended for public circulation, publication or for use by any third party. The contents of this report may not be reproduced in whole or in part without the prior written consent of Morgans. While this report is based on information from sources which Morgans believes are reliable, its accuracy and completeness cannot be guaranteed. Any opinions expressed reflect Morgans judgement at this date and are subject to change. Morgans is under no obligation to provide revised assessments in the event of changed circumstances. This report does not constitute an offer or invitation to purchase any securities and should not be relied upon in connection with any contract or commitment whatsoever.
Discuss in our Forums
See what other readers are saying about this article!
Click here to read & post comments.
3 posts so far.

 reddit this
 Seed Newsvine
 StumbleUpon
