Recent discussions about the CPI have brushed over a key change that occurred in the construction of the index in 1998. In its 13th Series the CPI became a pure price index utilising an acquisitions approach, rather than a cost-of-living index utilising an outlays approach. One feature of this change is that it removed land costs for owner-occupiers – something which doesn’t appear to reflect reality and provides some intriguing results.
The move to an acquisitions approach was in line with the broader philosophy of inflation measurement at the time. The OECD noted this philosophical change, commenting that modern inflation indexes:
…have been constructed with the aim of measuring monetary inflation rather than measuring the broader concept of the cost-of-living, which has a more welfare-oriented philosophy.
Advertisement
The ability to judge economic conditions with any degree of confidence is best achieved with both a cost-of-living index and a pure price index. Since 2003 the ABS has published its Analytical Living Cost Indexes for households (ALCI) to play the role of a cost-of-living index. This measure uses the outlays approach, and one would expect it could reveal some of the costs associated with the land price boom of the early 2000s.
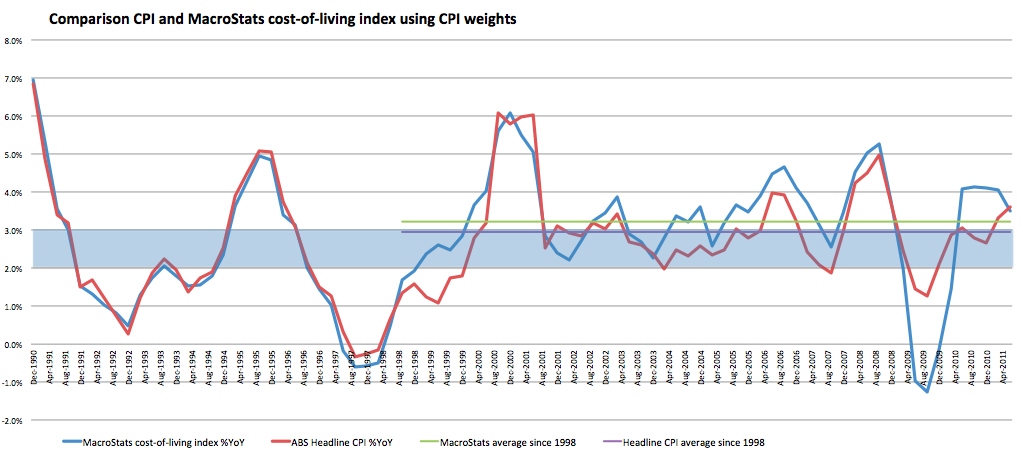
Yet the ACLI for employees is within 3% of the CPI after thirteen years. I can reconcile this outcome fairly closely with my own calculations using their method, and estimate a cost-of-living index around 0.3 percentage points higher than the CPI, on average, over the past 13 years. You will notice how this index tracks the CPI prior to 1998 (this method actually was the CPI calculation at that time). The graph is below.
However it is a little strange that the ABS conducted an evaluation of the impact of different treatments for housing in the CPI back in 2006 and found that a full cost-of-use approach, with weighting consistent with HES data (which the CPI does not have), would have produced a CPI between 1998 and 2003 more than double the official number (for Sydney). Considering that the official ALCIs were slightly lower than the CPI over this period, it is an odd situation indeed.
The reason for the discrepancy can be traced to a gap in the mortgage interest charge index between 1998, when it was removed from the CPI, and 2003, when it was added as a separate item in the ALCIs. The ABS cannot provide the data to bridge this series gap, and has suggested that simple interpolation is innappropriate due to rebasing of the ACLIs during this time.
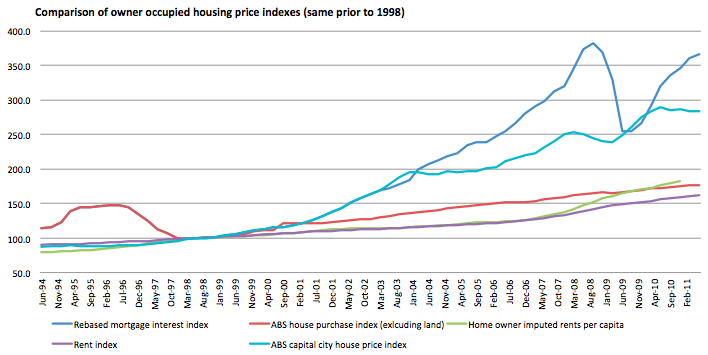
Below is a graph of the mortgage cost index rebased as per the ABS explanation and interpolated using the data on mortgage interest paid as a proportion of household income from the RBA. This mortgage interest charge index can be compared to the ABS house price index (HPI) from 1994. We can see that from 1998-2003 the HPI increased 64% while the mortgage interest charge index increased just 24%. Yet the mortgage rate was the same at the beginning and end of the period. We also know that the HPI was originally developed as an input to the mortgage interest charge index. It is this data which gives a cost-of-living estimate matching the published ACLIs.
Advertisement
But a more realistic reconciliation of the mortgage interest charge index would have this index tracking the HPI during the 1998-2003 period as shown in the graph below.

Discuss in our Forums
See what other readers are saying about this article!
Click here to read & post comments.
7 posts so far.


 reddit this
 Seed Newsvine
 StumbleUpon
