As far as it has been possible to establish, the 2004 Boxing Day tsunami claimed the lives of an estimated 230,000 people. Although the subsequent outpouring of concern was reassuring from a humanitarian point of view, the real effectiveness of the international community’s response to this disaster remained an open question, until a second major tsunami struck the Indonesian coast-line on July 17, 2006: an earthquake measuring 7.7 on the Richter Scale occurred 100 miles south of Java sending 2-7m waves up to 2km inland.
Although of little reassurance to the families and communities of the estimated 700 people who lost their lives to this second tsunami, it did provide a crucial sounding-board against which to examine the adequacy of the international response to the 2004 Boxing Day tsunami.
The short-term response to the occurrence of any disaster typically involves those relatively unaffected helping those adversely affected. This usually manifests in the form of donations (money, water, food, clothes and so on) and provision of skilled workers to boost local health-care efforts and re-build crucial infrastructure.
Advertisement
Although generous, this assistance was not provided without problems in the aftermath of the 2004 Boxing Day tsunami: money and goods may not have arrived where they were most needed (Meagre food supply stunting tsunami kids. The Sydney Morning Herald, January 30, 2005); and disagreements about how relief efforts ought to be organised and funded arose (Competition swallowing up tsunami aid money in Aceh. The Sydney Morning Herald, March 10, 2005). The principal danger of such short-term efforts, however, is that they become reduced to self-perpetuating repeats of humanitarian relief. If attempts are only ever made to solve immediate problems, then well-intentioned aid efforts inevitably succumb to a cycle of trying to help with one problem, while awaiting the next.
Since tsunamis are not preventable, and the time and location of their occurrence is not predictable with any useful accuracy, the most practical longer-term response is to minimise resultant harm. Early warning systems are one obvious harm minimisation strategy. In June 2006, the UN asserted that that an interim warning system was operational off the Indonesian coast, and although this system was triggered by the July 2006 tsunami, the estimated 700 lives lost indicates that such warnings (PDF 230KB) need to be communicated more efficiently to those most vulnerable.
A second harm minimisation strategy is the construction of built environments designed to withstand assaults far in excess of what might reasonably be expected to occur. New Zealand’s Federal Parliament House in Wellington, for example, is state-of-the-art earthquake resistant, using rubber and lead piers to separate the concrete beams of the building from the foundations, to minimise structural damage should the foundations move.
Given the technology for early warning systems and disaster-resistant built environments exists, and is most likely utilised by countries able to afford its additional cost, it might be expected that fewer deaths are associated with disasters that have impacted on economically developed countries. Even a cursory glance at a relatively recent history of earthquakes suggests this is the case.
On October 17, 1989, an earthquake measuring 7.1 on the Richter Scale struck San Francisco, followed by a 5.2 aftershock 37 minutes later, killing 62 people. On January 17, 1994, an earthquake measuring 6.6 hit Los Angeles, taking 60 lives. Exactly one year later, January 17, 1995, an earthquake measuring 7.2 struck Kobe in Japan, killing 6,432 people, while on September 26, 1997, an earthquake measuring 5.6 struck central Italy, killing 10 people.
In contrast, an earthquake measuring 6.1 on the Richter Scale struck Rostaq, Afghanistan on February 4, 1998, killing more than 4,000 people. On August 17, 1999, an earthquake measuring 6.7 in Izmit, Turkey, killed more than 17,000 people, while on December 26, 2003, an earthquake measuring 6.6 in Bam, Iran took approximately 26,271 lives. Finally, of course, the December 26, 2004 earthquake, which measured 9.0 and caused the tsunami, resulted in an estimated 230,000 deaths.
Advertisement
What do these figures indicate (other than that we ought to be very nervous on the days of the 17th and the 26th)? It is reasonably clear that the closer the earthquake’s epicentre is to populated regions, the closer the fault line is to the city, and the greater the population density, the greater will be the number of lives lost.
These factors would explain the discrepancy in the number of deaths in Japan, compared to the US and Italy: Kobe had a higher population density and the city itself was directly ruptured by the fault-line. However, these factors alone do not adequately account for the data. Los Angeles and San Francisco, in particular, would have had reasonably high populations and population densities at the time of their earthquakes and yet the number of lives lost in those cities was relatively small. In contrast, the earthquakes in Izmit and Bam claimed relatively high numbers of lives, despite those cities having relatively small populations of approximately 225,000.
Aggregating these earthquake data presents us with an emerging pattern that more adequately describes the relationship between the occurrence of an earthquake and the resultant number of lives lost. Earthquakes that have caused damage to developed countries have averaged a magnitude of 6.6 (excluding the San Francisco aftershock) and claimed 6,564 lives (or if the obviously more extreme case of Japan is removed, an average shock of magnitude 6.4, claiming 132 lives).
Earthquakes that have caused damage to developing countries have averaged a magnitude of 7.1 and claimed 277,271 lives (assuming a final death toll from the 2004 Boxing Day tsunami of 230,000). This suggests developing countries, relative to developed countries, have experienced shocks of approximately 0.5 greater magnitude (7.1 versus 6.6) and a death toll in the order of 40 times greater (277,271 versus 6,564). The on-average greater intensity of the earthquakes to have struck developing countries seems to be of a disproportionately low magnitude, relative to the higher death rates.
It is true that the tsunami was a different kind of disaster, compared to land-based earthquakes, such that the damage caused and the number of lives lost as a result of the tsunami may be atypical. However, the pattern of a disproportionately greater number of deaths in developing, relative to developed, countries holds when the tsunami is excluded from the comparison.
In that scenario, developing countries have experienced earthquakes of a comparable average magnitude (6.5 versus 6.6), but have experienced a death toll approximately seven to eight times greater (47,271 versus 6,564). Given the strength of this pattern, it is hardly surprising that it appears applicable elsewhere: in Sub-Saharan Africa, for example, the estimated HIV-AIDS prevalence rate of 7.4 per cent of the adult population compares to 0.2 per cent in Oceania and 0.6 per cent in North America.
These observations provide a compelling argument that the economic fragility of developing countries increases their vulnerability to public health disasters disproportionately, and raises the possibility of economic development as an effective lever for minimising the impact of such disasters. There appear to be two complementary possibilities: reduce economic inequities between countries, and improve public health infrastructure within developing countries.
One way to reduce economic inequities between countries is through aid programs. An examination of current financial assistance from developed countries to developing countries, however, shows only five (Sweden, Luxembourg, The Netherlands, Denmark and Norway) meet the UN target of donating 0.7 per cent of Gross National Income (GNI). In 2004-2005, Australia committed 0.26 per cent of its GNI, or 26 cents for every $100 earned. Even if developed countries perceive the UN target as unreasonable, there are other opportunities to promote greater equity: fairer trade deals, if not compassionate deals that actually favour poorer countries; ongoing reduction or cancellation of Third-World debt; and provision of a lower proportion of tied aid.
The argument for greater assistance from developed countries does not necessarily mean that they will be relatively economically worse off then they are currently. One way to demonstrate this is in terms of a Bell curve.
Figure One: Current and target distributions of wealth between countries
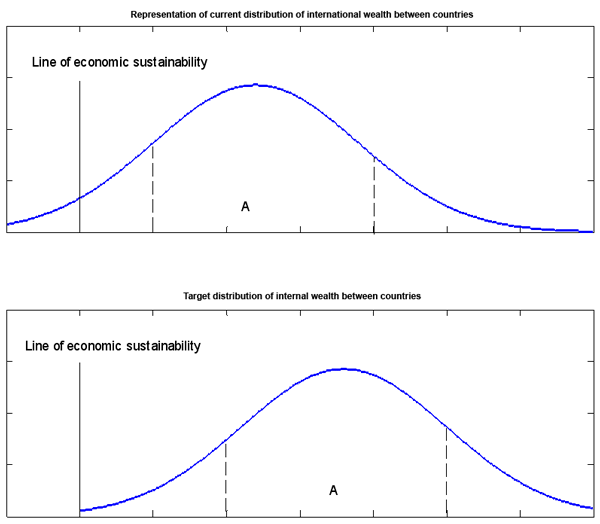
Figure One delineates a basic relationship between the levels of economic wealth of different countries, where most countries may fall into the middle, or average, section (section A), some countries are below average (they sit on the curve to the left of section A) and some countries are above average (to the right of section A).
There are two crucial points here. First, the current distribution graph shows that a number of countries of below average economic wealth are also below (that is, to the left) of the arbitrary economic sustainability line, while the target distribution graph shows a shift of the whole curve to the right, such that no countries are below the economic sustainability line. Second, the shape of the curve is preserved despite the shift to the right: some countries are still more economically wealthy than others, but no countries are left below the line of economic sustainability.
In addition to a more equitable distribution of global wealth, developing countries should continue to work to improve their domestic economies, thereby increasing the likelihood they will obtain more effective international economic assistance.
Although leaders from developed countries have reasonably expressed concern about the use of foreign aid in some countries, it is not reasonable for assistance from developed countries to be exclusively dependent on the elimination of corruption in the domestic economies of developing countries. Corruption within public offices is both a cause and a symptom of economic hardship and, indeed, the example of developed countries suggests corruption will be reduced, or at least become less visible, by economic development. Such concern is clearly indefensible if it is used to justify the maintenance of a manifestly inequitable allocation of global wealth.
In summary, although the short-term response to the 2004 Boxing Day tsunami appears to have been reasonable, the greatest international response failure is the obvious unwillingness to seriously consider increased economic equity between developed and developing countries, as the most effective longer-term strategy to reduce harms associated with public health disasters.
Despite the short-term strategies implemented, the July 17, 2006 tsunami still resulted in a loss of life in the order of 10 times that which occurred over 15 years ago as a result of the San Francisco and Los Angeles earthquakes. The economies of Third-World countries must be developed.
Acknowledgements: Mr Stuart Gilmour (Statistician, University of NSW) produced the graphic. He, along with Associate Professor James C. Frankish (Assistant Director, Institute for Health Promotion Research, University of British Columbia, Canada) and Associate Professor Christopher Doran (NDARC, University of NSW) provided valuable improvements to the essay.

 reddit this
 Seed Newsvine
 StumbleUpon