The question of majority government will always be a key issue in Tasmanian elections because the Hare-Clark system of proportional representation makes the possibility of a hung parliament much more likely than in other states.
Adding extra interest to the next election (due sometime before September 2006) is the Liberals’ surprising (to many) declaration that they are not interested in minority government: for them, apparently, it is majority or nothing. (To view a copy of a document signed by all parliamentary Liberal members go to www.taslib.net and click on the policy document prompt in the left-hand corner.) So, what are their prospects of gaining that majority?
This paper uses two data sources - (i) the results from the last election held in 2002, and (ii) the Morgan Polls of voters’ first preference choice since then - and concludes that, if an election was held in August 2005, Labor would win 12 seats, the Liberals 8, the Greens 2 with 3 seats undecided. It then introduces a new measure, the election quotient, to assess the likelihood of various parliamentary outcomes. It finds that a Labor majority has an election quotient of .875, a hung result an election quotient of .125, and a Liberal majority an election quotient of zero.
Advertisement
It further calculates the election quotients for a series of swings should they occur on election day. It finds the following:

Finally the findings are considered in an historical context. The conclusion is that swings of the amount the Tasmanian Liberals need to gain even an outside chance of majority are twice to three times those achieved by any opposition party at an election in modern Australian political history.
Polls
The Morgan Poll is the only national polling company to regularly test the Tasmanian political climate, conducting a survey of voting intentions every four months. Local firm EMRS also undertake similar polling, however, their polls are not at regular intervals and the results tend to move around much more than Morgan. In addition EMRS usually interview about 20 per cent fewer respondents. The most recent EMRS poll, held in early August 2005, showed the following (after excluding those who were undecided): 50 per cent Labor; 29 per cent Liberals; 17 per cent Greens.
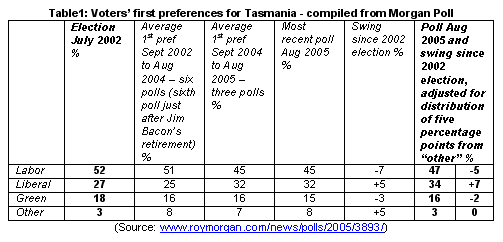
The Morgan Poll is used for this paper. Table 1 is a summary of those polls since the July 2002 election, the most striking feature being what might be called the “Jim Bacon factor”. The table suggests that voters withdrew 6-7 per cent support for Labor upon the retirement (and subsequent sad death) in mid-2004 of the immensely popular premier. Over a year has past and the Liberals have been unable to improve on the initial poll boost that event brought them.

Advertisement
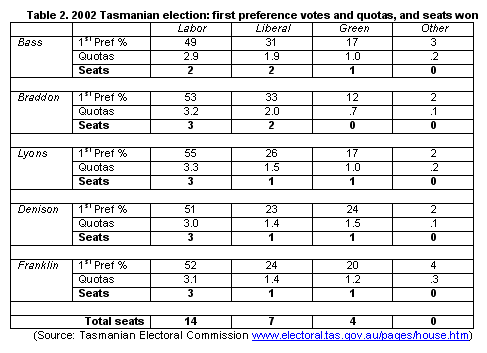
As Table 1 shows, as at August 2005 the Liberals have 32 per cent support, up 5 per cent on the 2002 election, Labor 45 per cent (down 7 per cent), the Greens 15 per cent (down 3) and “others” 8 per cent (up 5). The last election delivered Labor 14 seats and a majority in the 25 seat parliament, the Liberals 7 and the Greens 4, a quota being 16.7 per cent. So, on the face of it, 32 per cent support now gives the Liberals just on 2 quotas per electorate and notionally a possible return of 10 seats if an election was held today. But things are not that simple: historically the electorates have varied markedly in their party support profiles, so applying the poll results across the whole state is far too blunt a prediction tool. (Unfortunately Morgan do not provide an electorate by electorate breakdown.)

Swings
One way to gauge how the electorates might have voted is to apply, on an electorate-by-electorate basis, the swings revealed in the poll. For the purposes of this paper, these swings have been adjusted by distributing five percentage points from the “other” category to the parties’ August 2005 poll results. This is to remove the effect of the usual tendency in mid-term polls to show a higher than election day non-main party vote. The distribution has been made on a 2 Labor, 2 Liberal, 1 Green, basis which is simplistic, but well within reason for the purposes here. See the final column in Table 1 for the adjusted vote and swing. To complete the data set, Table 2 shows the results of the 2002 election in terms of first preference vote percentages, first preference quotas, and seats won.
Discuss in our Forums
See what other readers are saying about this article!
Click here to read & post comments.
3 posts so far.