The picture routinely pushed by Government and the renewables industry shows Australia's main renewables, solar and wind, roaring ahead at record rates. It's pure fiction. The Government's own statistics prove that growth, heavily subsidised over almost a decade, is modest and steady. And the official numbers, the governments' own statistics, tell us that at this modest steady rate it will take nearly 70 years for the energy transition to reach completion.
Renewables growth is undeniably slow! Which of course doesn't mean it won't be denied.
Contrast this reality with the message consistently spread by government politicians and industry enthusiasts. Our renewable energy transition is exciting, it's approaching fast, it's inevitable, it's successful. And it's ambitious; the aims keep growing. Just the other day, (23 September 2025), Australia's Climate Change and Energy Minister Chris Bowen, in New York for United Nations Climate Week, announced a new even bigger Australian emissions reduction commitment. By 2035 emissions will be 62%–70% below 2005 levels, all due to renewables growth. The emissions target aligns with achieving 82 % renewable electricity by 2030. Wow!
Advertisement
The popular narrative calls ita "clean energy revolution". Australia is a global leader, a "renewable energy superpower". And our Mr Bowen enthuses that "renewables would overtake coal as the largest global energy source sometime this calendar year".
It's not just Australia; breathless boasting and cheering about renewables is the norm worldwide. At that same UN meeting (High-Level Session on Renewable Energy Abundance, convened as it happens by Australia's mining giant Fortescue), European Commission President Ursula von der Leyen celebrated:
· Almost half of Europe's power now comes from renewables.
· Solar and wind are our fastest growing sources of energy.
· In 2024 "almost two trillion dollars was invested worldwide in clean energy – twice the investment that had gone into fossil fuels".
· 90 per cent of new renewables projects were now generating power more cheaply than fossil fuels.
Advertisement
Here in Australia there's some minor dissent. Residents in rural areas express their dislike of the unavoidably large environmental footprints of solar and wind farms and the long transmission systems required to get electricity to centres of population and industry. And there's a bit of scepticism about government claims that solar and wind energy "are the cheapest". Minister Bowen easily dismisses such concerns. He stands rock solid. Renewables policy dissent comes from "cranks and crackpots", displaying their "climate change denialism".
The renewables growth strategy is straightforward. Australia's governments, state and federal, are aligned. They set renewables policies and drive them with subsidies. Targets and subsidies. That's the growth strategy. It is vigorously supported by government propaganda. Firm construction plans with schedules, locations, budgets etc. are not conspicuous. What's stands out is the repetitious official enthusiasm for the energy transition. It works. Public approval remains solid, governments get re-elected, any signs of serious disapproval are easily dismissed.
A new element has recently emerged. The Australian Human Rights Commission, our Human Rights watchdog, has weighed in on critics of energy policy. In its submission to the Senate Select Committee on Information Integrity on Climate Change and Energy (published 19 September 2025) the AHRC said: "False narratives distort public understanding, erode trust in science and institutions and delay urgent climate action". All a bit vague. Does the AHRC suggest that all criticisms of energy policy are false, perhaps punishable? I hope not. Especially as I'm about to tell you that energy policymakers and the renewable energy industry they created are guilty of seriously exaggerating the prospects of our energy transition succeeding. They might even be lying.
My concerns about energy policy began when I saw how difficult it was to interpret the main renewables policy "performance indicator" in Australia, "percent renewables". This indicator is a measure of the contributions of each of the several energy sources making up our electricity supplies. The indicator is easily determined and technically valid. But it is prone to misleading its users on the true progress of an energy transition. Worse it does not convey a true picture of trajectories for continuing fossil fuel usage and accompanying emissions of carbon dioxide.
"100% renewables" is a particular stumbling block. Let's look at an electricity supply claiming to comprise "100% renewables". Canberra's (the Australian Capital Territory grid) has officially been "100% renewable" since 2020. Does this mean Canberra can boast zero carbon dioxide emissions? No, it doesn't. All one needs for proof is a quick check of the traffic on Canberra's (very nice) roads.
So, what exactly does "100% renewables" mean, in terms of emissions? It's helpful to start with data from early in the transition. Most electricity then was generated in Australia by burning fossil fuels, mainly coal, in traditional thermal power stations. The statistics for 2019, for example, showed that only 37% of Australia's fossil fuel consumption was burnt in power stations. The other 63% was used elsewhere. Renewables can replace the 37% used for electricity generation. That's it.
How could cleaning up all of that 37% by running power stations on renewables possibly eliminate fossil fuel usage?
It can't.
In 2019 fossil fuels continued to be consumed in transportation, in heavy industries like smelting of metal ores and production of nitrogenous fertilisers, explosives and plastics, and in many smaller uses. (One can easily find long and fascinating lists of such minor applications. Claims that these amount to 6,000 items regularly pop up. It seems there's no "official list".)
The continued reliance on fossil fuels well after electricity generation switches over to renewables leads to only one possible conclusion. "Percent renewables" is a useless measure of progress in reducing fossil fuel consumption and associated carbon dioxide emissions. All the boasting and back-slapping that accompany hitting a "percent renewables" target are to do with politics, not reducing emissions.
There's no scientific rigour in Australia's energy policies.
Can we do better? Is there a correct, workable metric for assessing the true progress of this energy transition? Yes, there is.
Firstly, there's no doubt that clean energy in the form of electricity remains the key to any future clean economy. Electricity generated with low accompanying levels of carbon dioxide, as with renewables and nuclear energy, must remain the core contributor to a clean energy transition.
How should progress of that transition best be measured? Obviously, accounts for clean electricity production must still be maintained. Annual growth should be documented. The quantity of clean electricity needed to complete the transition must be estimated on some credible basis (and clearly "100% renewables" won't do). And such procedures should enable calculation of a date for completion of the transition.
The table gives a definitive example. It shows the past eight years of data, in energy units, starting from the early days of renewables policies. The numbers all come from the official statistical sources for all of Australia's electricity supply, the Energy Statistics and Analysis Section of Mr Bowen's Department of Climate Change, Energy, the Environment and Water.
These are statistics for all of Australia. They are preferable to data for the NEM (National Electricity Market) alone, which cover only 80 – 85% of Australia's total electricity generation, mainly the East Coast Grid. Many commentators like using NEM data because of their availability in real time. But they are only partial.
Australia's Renewables Generation 2017 to 2024, PJ
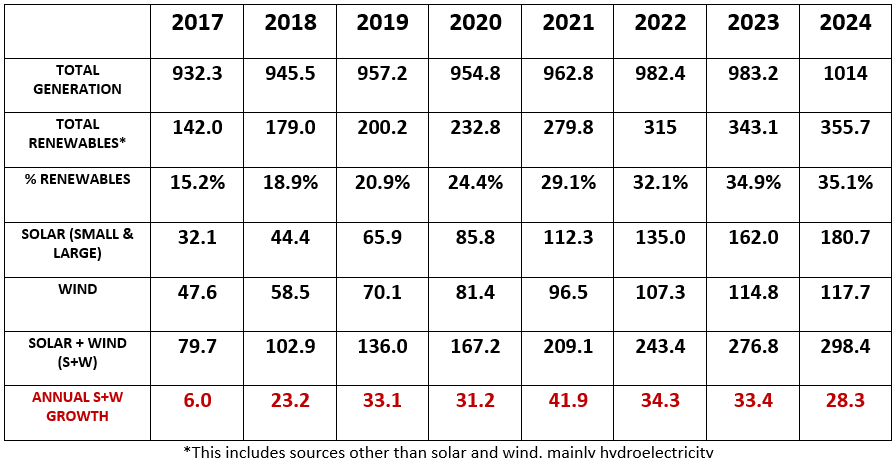
National statistics also happen to use the energy unit I regard as the most convenient for these purposes in terms of manageable numbers, the petajoule (PJ). 1 PJ = 1 x 10¹⁵ joules. Some prefer units more "traditional" for electricity, like the terawatt-hour (1 TWh = 3.6 PJ). Online websites now make conversion from one unit to another very simple.
The last two rows of the table, "SOLAR + WIND", are composites of the original data. They deserve a special place as they reflect exactly where growth in Australia's clean energy is occurring.
The bottom row, in red, is the key to describing and interpreting Australia's clean energy growth rates. One can conclude from that row that incremental growth in clean electricity output since 2017, from solar and wind energy, has been modest and fairly steady. It shows no significant tendency towards rising or falling. Average growth over seven years has been approximately 32 PJ per year. In relation to Australia's total annual generation of about 1000 PJ per year (top row) that's a growth rate of 3%.
The boasting and bluster one sees for renewables growth in Australia turns out to be referring to growth of 3%! It's defective. The real issue is whether the defects come from ignorance or fabrication.
The one thing that's certain is how widespread is the misunderstanding of renewables growth rate. Today ChatGPT tells me unequivocally that Australia's renewable energy output is growing "fast". That's a clear measure of how firmly embedded in the Australian mindset is the flood of nonsense fed to Australians by governments and the renewables lobby. Propaganda still works.
Why haven't others noticed the conspicuous deficiencies and inconsistencies outlined here. Politicians are of course forced by their jobs to be stuck in ruts. But surely some of the eminent scientists involved in energy matters have noticed. I have broached the subject with a few. They shrug their shoulders. It's a mystery.
One final calculation closes the argument. What is the correct ultimate clean energy target appropriate for completing Australia's energy transition? And how long will it take to hit it?
This topic needs more attention. Estimates must be rough because several large fossil-fuel based energy-intensive industries still cannot switch to electricity, so we have no real knowledge of what their electricity consumption will be.
I have made a rough estimate, based on analogies, that a future all-electric economy would need to consume around 2.5 times present electricity generation. The existence of other similar estimates is encouraging but it would be wrong to suggest there's a consensus.
For want of something better let's for the moment take 2.5 as the multiplier. In rough terms total electricity consumption is presently around 1000 PJ per annum (see the table). So, fully electrified, our economy would need 2,500 PJ clean electricity. 300 PJ now comes from solar/wind. It's growing at 32 PJ per annum. So it will reach 2,500 PJ in 2,200/32 years.
69 years to reach a credible target! Yes, Australia's clean energy growth from renewables is, and promises to remain, very slow. Our clean energy strategy is weak. And the hype coming from government and their mates in the clean energy business has succeeded in thoroughly distorting public perceptions about solar and wind energy to ensure nothing changes.
Maybe it's worth reminding Australians that if we really want fast clean energy growth we should recognise that worldwide there are over 400 nuclear reactors producing heat for thermal power generation, each capable of putting out around 30 PJ clean electricity per year. A few of those in power stations would go a long way here. And they could fit neatly where power stations always did.

 reddit this
 Seed Newsvine
 StumbleUpon
