Over recent weeks, a few people have asked me: Is the US going into recession? The reason for this question is because of the various commentaries by financial journalists showing that an inversion of the US yield curve is a signal for US recession. So, what I want to do today is a "How-To" piece. How do you look up the US yield curve for yourself on the Federal Reserve Economic Database or FRED, and how can you come to your own decision from the yield curve as to whether the US is going into a recession?
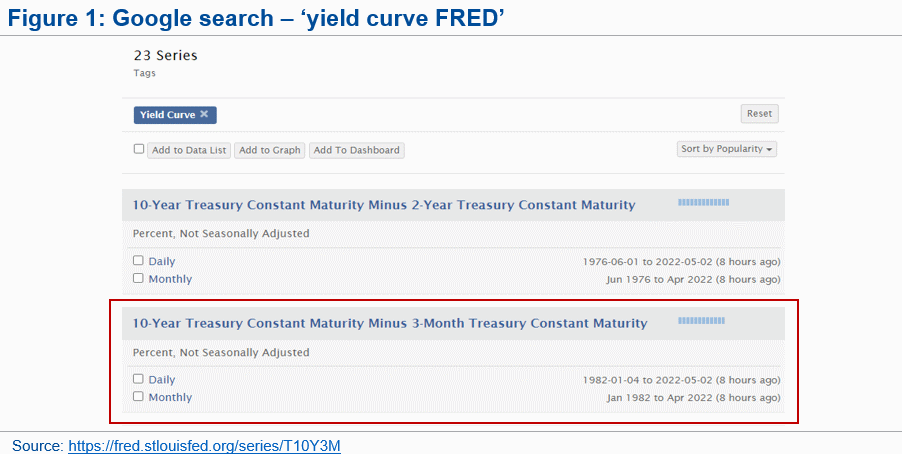
The first step is to Google search for 'yield curve FRED', and choose the link titled '10-Year Treasury Constant Maturity Minus 3-Month Treasury Constant Maturity'. This will take you to the linkshown above in the red box. This link gives you a first glimpse of the yield curve as the Federal Reserve likes to think about it. This is a 5-year period showing the difference between 90-day treasury bills and US 10-year bonds.
Advertisement
At the top of that screen, select 'max'. This will take you to the longest data series that we want to talk about now, which is 40 years of data of the shape of the yield curve. The difference between US 90-day treasury bills and US 10-year Bonds.
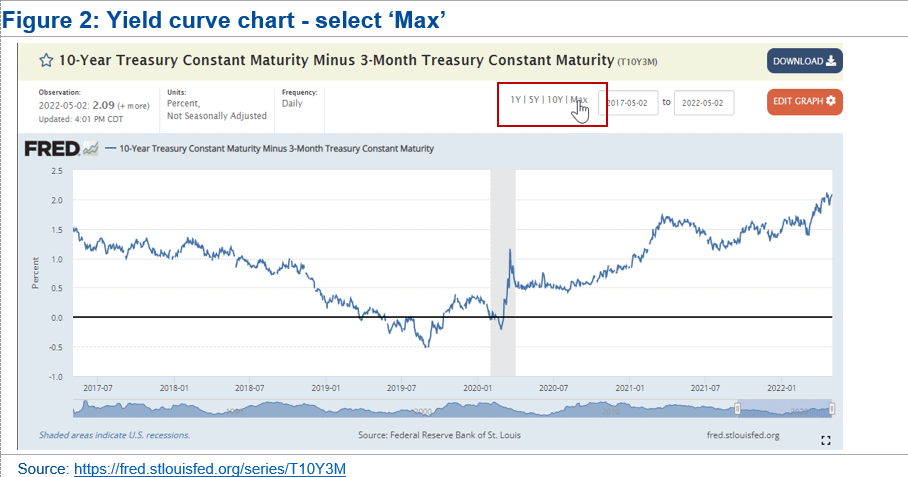
When you look at this chart you will see that the Federal Reserve has already shaded in the periods of recession in the US economy in the last 40 years. It is not the US treasury that determines when the US is in recession, it is the National Bureau of Economic Research that makes that decision and provides those dates of recessions. Those are the shaded grey areas you should now see on the slide.

What we are looking at is, as I say, the difference between 90-day treasury bills and 10-year bonds. As that rises, what is happening is 10-year bond yields are going up relative to 90-day yields. The reason that is happening is the US economy is going through a period of increasing real demand for capital because investment is increasing.
After the Federal Reserve has observed a couple of years of increasing real demand for capital driving investment in the US economy and driving up long-term interest rates, it will likely conclude (based on rapidly rising wages and or inflation) that the US economy is running out of room to grow. The Fed will then move to push up short-term interest rates relative to where 10-year bond yields are.
Advertisement
After a period, you will get to a point where US 90-day treasury bills are higher than 10-year bonds. When that happens, the yield curve inverts, and the difference between the two drops down to the line below zero. It is that point when the Federal Reserve has tightened to the point where it has choked off the flow of funds to new investment in the US economy. Then the US goes into recession after a period after that. What you will see after these yield curves drops into negative territory is a shaded area showing that a recession occurred.
It is interesting that the shaded area on the chart which tells us when the pandemic occurred, occurs after a period of an inverted yield curve. What that tells us is that we were going to have a recession in the US economy anyway, except it would have been much shallower and longer lasting than was the actual event, which fell upon the US economy because of the shutdown pandemic-induced.
What we cannot see from the chart is that right now long-term interest rates are rising relative to short-term interest rates and the yield curve is becoming increasingly positive. That means investment is increasing in the US economy. Right now, a recession for the US economy is nowhere near in sight.
The information contained in this report is provided to you by Morgans Financial Limited as general advice only and is made without consideration of an individual's relevant personal circumstances. Morgans Financial Limited ABN 49 010 669 726, its related bodies corporate, directors and officers, employees, authorised representatives and agents ("Morgans") do not accept any liability for any loss or damage arising from or in connection with any action taken or not taken based on information contained in this report, or for any errors or omissions contained within. It is recommended that any persons who wish to act upon this report consult with their Morgans investment adviser before doing so. Those acting upon such information without advice do so entirely at their own risk.
This report was prepared as private communication to clients of Morgans and is not intended for public circulation, publication or for use by any third party. The contents of this report may not be reproduced in whole or in part without the prior written consent of Morgans. While this report is based on information from sources which Morgans believes are reliable, its accuracy and completeness cannot be guaranteed. Any opinions expressed reflect Morgans judgement at this date and are subject to change. Morgans is under no obligation to provide revised assessments in the event of changed circumstances. This report does not constitute an offer or invitation to purchase any securities and should not be relied upon in connection with any contract or commitment whatsoever.
Discuss in our Forums
See what other readers are saying about this article!
Click here to read & post comments.
7 posts so far.

 reddit this
 Seed Newsvine
 StumbleUpon
