Five years ago I wrote here on the subject Can renewables meet public and political expectations?, concluding with the view that "Australians who expect 100% renewables will be disappointed". The case rested on basic renewables properties, including intrinsic limitations of intermittency, low energy intensity, concerns about the "battery revolution" for large-scale energy storage, and low energy return on investment (EROI).
Armed with five more years of evidence I revisit the topic here.
Premises
Advertisement
Cutting carbon dioxide (CO2) emissions is desirable policy. Energy from fossil fuels is a major source of those emissions. The main remedy is "clean energy", defined by zero or low CO2 emissions over a full energy life-cycle covering raw materials, manufacture, construction, etc. Clean energy sources include nuclear and a group dubbed renewables – hydroelectricity, solar, wind, and minor sources such as geothermal and biomass. Widespread environmental concerns about further hydroelectric dam construction will limit future growth of hydroelectricity. Solar and wind have wide public appeal as natural clean sources; they are the acknowledged growth sources. Carbon capture and storage technology, potentially enabling continued use of fossil fuels, is not yet commercial and is excluded here.
Clean energy is electrical energy, it reaches users as electricity, a clean energy economy will be all-electric, and solar and wind are the favoured clean energy growth sources.
Assessing the state of play
The core issues for policymaking are:
1. How much clean electrical energy will Australia need?
2. How will that quantity be generated?
Advertisement
3. How will "everything be electrified", i.e. converted to using electricity?
The second dominates public discourse, with the answer almost always "renewables". Renewables targets are synonymous with clean energy targets. Setting, attaining and raising targets occupy political debate. The ACT has already reached its 100% renewables target. South Australia aims at 75% by 2025, Victoria and Queensland both have 50% targets by 2030. A higher new target, Net Zero Emissions, is being discussed nationally – see below.
Targets are nearly always expressed as percentages. Sometimes their meaning is unclear. Actual numerical quantities are preferred here.
There is a buoyant mood within the renewables industry, its supporters, and various governments and agencies, typified by expansive claims, self-congratulation, bold plans and extravagant headlines. The habit of quoting growth in terms of added capacity (maximum power output) rather than energy magnifies impressions of growth since output of intermittent renewables varies between zero and nameplate capacity.
Evocative marketing descriptions like "renewable energy powerhouse" are common even in official government announcements. "Australia strengthened its position as a renewable energy powerhouse in 2020" says aFebruary 2021 press release from the Federal energy minister's office.
The excited mood tends to overshadow sober analysis. I'm reminded of the "irrational exuberance" of the dot-com boom. It encourages wishful thinking and presents a risk to sound policy development. Hence the present analysis, which relies on official statistics and energy quantities for targets and performance assessment.
Renewables growth rates and performance indicators
Table 1 summarises the recent history of Australia's electrical energy output. Units are petajoules PJ, the basis for most of Australia's energy statistics. 1 PJ = 1015 joules. For the size of Australia's energy systems (e.g. typical 1 gigawatt power stations produce about 30 PJ per annum)petajoules offers convenient numerical quantities and accessible analysis.
Table 1. Australia's electricity (PJ): the state of play
Data from Australian Energy Statistics Table O
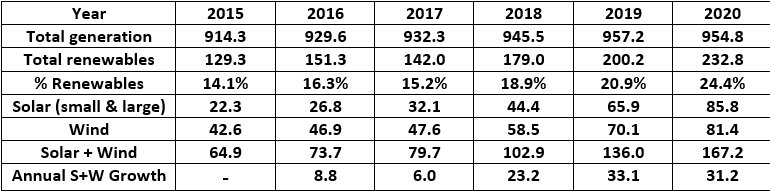
Salient points are:
- Solar and wind were the growth sources.
- Total electricity output rose modestly (4.4%) over the period.
- Total renewables content grew from 14.1% in 2015 to 24.4% in 2020.
- Solar and wind components grew faster than total renewables. Solar rose nearly four-fold. Wind almost doubled.
- Annual growth of solar + wind energy (last row) shows signs of levelling off. This may well be temporary. The maximum growth rate to date is 33.1 PJ per annum, reached in 2019.
Growth rate as per the last row measures the true rate of approach to targets and ought to be the key performance indicator. It never gets mentioned.
Fossil fuel consumption in Australia's electricity supply
CO2 emissionsfall as fossil fuel usage in electricity generation declines. That's the main aim of replacing fossil fuels with renewables.
Table 2. A decade of fossil fuel consumption in Australia's electricity supply sector, PJ
Data from Department of Industry, Science, Energy and Resources, Australian Energy Statistics
Table F, Section 26 Electricity supply, Fuels consumed (September 2020)
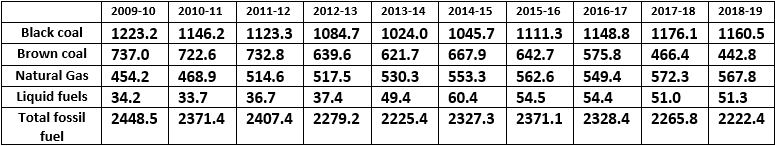
Table 2 shows coal use dropping, especially higher-emission brown coal, where mine and plant closures were widely reported. On the other hand natural gas and liquid fuel usage rose. Total fossil fuel use (last row) showed a small irregular downward trend of around 1% per annum. Over 10 years renewables grew from 78.5 PJ to 187.3 PJ, i.e. 239%.
Why does the drop in fossil fuel consumption, 10% over 10 years, not reflect renewables growth? Solar and wind intermittency is the likely explanation. When generation drops the slack is taken up by fast-starting open-cycle gas turbines and/or diesel generators. Contrary to widespread opinion, batteries do not have that role though they do play a specialised part in the national grid, providing so-called Frequency Control Ancillary Services. There are plans to increase pumped hydro storage, which is suited to grid scale. But as things stand backup still relies largely on fossil fuels.
Fossil fuels – power stations vs the rest
The breakdown of total fossil fuel consumption for electricity generation (thermal electricity) can tell a lot about future reduction of emissions. Table 3 gives the data for financial year 2018-19, the latest full year available.
Table 3. Fossil fuels in Australia's electricity supply sector 2018-19, PJ
(Same source as Table 2)
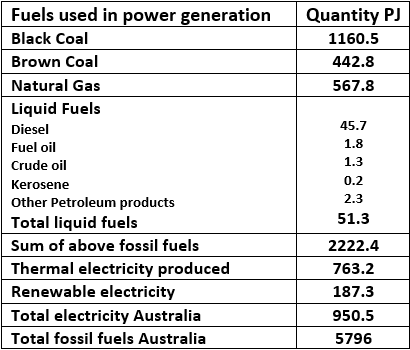
The key information is that Australia's total fossil fuel consumption that year was 5796 PJ. Of that, 2222.4 PJ or 38% was burnt in power stations to produce 763.2 PJ thermal electricity. The rest, 62%, went elsewhere.
These numbers point unequivocally to the significance of "% renewables". If all electricity that year came from renewables it would properly be described as "100% renewables". Fossil fuel consumption would be lowered by 2222.4 PJ, the bulk would remain.
"100% renewables" does not mean the end of fossil fuels. Confusion on this matter is common.
This reasoning leads to another significant conclusion. Take the year quoted above as the example. Renewables generation of 950.5 PJ electrical energy, "100% renewables", would displace 38% of total fossil fuel consumption. This number immediately suggests a way of estimating how much clean electricity might be needed to get rid of all fossil fuels, including the other 62%.
1/0.38 = 2.63. As 950.5 PJ clean electricity would displace 38% of fossil fuel, it is a small step to suggest that 2.63 times that amount might replace all fossil fuel. So for this example 2.63 X 950.5 = 2500 PJ might constitute enough clean electricity to eliminate all fossil fuel consumption (in that sample year). In the current terminology that would translate to "263% renewables".
There are many assumptions implicit in the above reasoning and "260%" (rounded) can be only a rough estimate. In my view there is no possibility that it can be less than 260% and a strong likelihood it is higher. But 2500 PJ is a reasonable start for assessing adequacy of prevailing renewables growth rates in reaching targets.
The key to arriving at more reliable target estimates is greater knowledge of what is involved in "electrifying everything", including detailed process flow charts and electrical energy consumptions. That's a huge challenge. Anyone who thinks otherwise should talk to experienced process development engineers. Ideas are always plentiful; turning them into viable industrial technologies is a long, risky, expensive process.
Targets and growth rates: the state of play
Two targets are in play, one for replacing existing electricity supplies, the other for replacing all fossil fuel usage. A third higher target is emerging and should be included in scenarios. It provides for a surplus of clean energy for creating a clean energy export industry as described in Professor Ross Garnaut's book Superpower.
A relevant plan from conservation organisation WWF-Australia, Making Australia a Renewable Export Powerhouse (2020), quantifies three such stages of renewables growth. It is a convenient model for testing goals against the current state of play.
WWF goals are:
A. 100% renewables, for cleaning up electricity supplies.
B. 300% renewables, for an all-electric economy.
C. 700% renewables, for yielding a clean energy surplus to supply new green energy export industries with products like "green hydrogen" produced electrolytically with clean electricity.
WWF chose 700% so as to yield green fuel exports at scale equivalent to Australia's present LNG trade.
Let's see how those targets look against 2020 solar/wind growth rates (Table 1). To keep things simple, numbers are rounded and adjustments for changes in GDP per capita, population etc. over the intervening years are ignored.
Starting parameters are: total electricity 955 PJ; existing renewables output 235 PJ; solar/wind growth constant at 31 PJ per annum. The above three WWF goals become
A. 955 PJ
B. 2865 PJ and
C. 6685 PJ.
Hence, reaching
A. 100% renewables would take 23 years
B. 300% renewables would take 85 years
C. 700% renewables would take 208 years.
Higher growth rates seem necessary. A threefold increase to 93 PJ per annum has the outputs reaching goals in 8, 28 and 69 years respectively. A tenfold increase to 310 PJ per annum reduces those periods to 2.3, 8.5 and 21 years.
These illustrative calculations show that present near-record growth rates would be much too low to meet stated ambitions within practical time scales. Growth would need to be between three and ten times faster. Calculations of this kind can be repeated for any chosen set of data. Expressing targets and growth rates as energy quantities is the key to valid calculations.
Net Zero Emissions
"Net Zero Emissions" is the new clean goal sweeping the world. It equates roughly to the above 300% goal for clean energy but also includes a separate provision for removing some existing CO2 content from the atmosphere. That's where "net" comes in. Apart from planting more trees and raising soil organic matter (biomass) content, the required removal technologies are generally not specified and do not now exist. A target date of 2050 is often mentioned.
Australia seems ready to sign up to NZE despite lack of pathways and costs. The politics demands expression of intent; feasibility can wait. But it's certain that an NZE target will require generation of at least "300% renewables" and growth rates three to ten times higher than now.
Will renewables be enough?
Will a clean energy strategy confined to renewables do the job of reaching distant targets?
Australia's clean energy options are restricted by its nuclear energy ban. Nuclear energy was once simply feared. Now it is routinely dismissed as "too slow, too expensive". With an emerging need for faster growth of clean electricity, that objection must now be thoroughly examined.
On renewables costs, published industry data indicate that over the last 8 years at least $20 billion was spent on the solar and wind assets that in 2020 generated 167 PJ clean electricity per annum. Compare that with targets in the range of 2900 to 6700 PJ per annum being contemplated. The quoted expenditure contained no provision for making intermittent sources reliable through storage, etc. It is not the full cost of a reliable renewables-based electricity supply customers reasonably expect.
How much would nuclear energy cost? What time scale is required? How do those figures compare with solar and wind energy when costs include backup and periodic replacement of solar panels and wind turbines?
Costs are a big subject. Present claims regarding nuclear costs seem to rely on government inquiries and consultant reports. This is a naïve approach. My view is that the commercial costs for an illegal technology cannot be obtained by those means. At the very least tenders and quotations that involve the energy and nuclear construction industries are essential.
Objections to nuclear energy on grounds of cost and time taken cannot properly be tested while nuclear energy remains illegal. Until the ban is removed, the cost of nuclear energy in Australia is best regarded as an unknown quantity. When that is corrected Australia can decide how best to proceed towards its clean energy future.

 reddit this
 Seed Newsvine
 StumbleUpon
