The Coalition has promised to cut corporate taxes by 5% over the next ten years. Some economists have been very publicly unable to find the relationship between corporate tax cuts and growth in GDP. We thought we would look at the research that is available on this and provide our own conclusions on the matter.
The most widely discussed analysis is conducted by the Australian Treasury in support of the Business Tax Working Group. Chapter 1, section 44 of this report notes that a 1% cut in the company tax rate from 30% to 29% would increase the level of GDP by 0.2%.
The Coalition proposal is for the company tax rate to ultimately be cut from 30% to 25%, a 5% reduction. The Treasury modelling might then be extrapolated to conclude this 5% reduction might increase the level of GDP by about 1%.
Advertisement
We analyse how these changes may occur and then provide our own conclusions.
A Theoretical Examination
We think that profits lead retained earnings. Retained earnings then lead investment. Investment then leads employment. Retained earnings are affected by business costs. One of those costs is interest rates. Another of those costs is corporate taxes.
We are all familiar with the process by which interest rates lead investment and investment leads employment. We know that a cut in interest rates by the Reserve Bank is regularly and observably followed by our higher level of investment. We then know that that higher level of investment then leads to more employment.
The reason that a cut in interest rates leads to more investment is that a cut in interest rates means that a higher proportion of profits are left over to invest.
How does a cut in corporate tax stimulate the economy?
Advertisement
In Keynesian Economics, the Keynesian multiplier demonstrates how an increase in spending somewhere in the economy – whether it be in consumption or investment - stimulates further spending in other parts of the economy. Total spending and GDP can be increased by more than the original spending. Both investment spending and consumption spending can and usually would be stimulated, along with increased jobs in both the consumption and investment supply sectors.
This extra spending throughout the economy can be brought about by government changing its taxing and spending activities. The proposed cut to corporate tax represents just such a change. One part of the initial stimulus will be through increased retained earnings by companies leading to increased investment spending by those companies.
This initial extra spending will then lead to further extra spending by those companies providing the plant and equipment. There would be extra spending by their workforces, leading to additional income for the owners of those companies providing supplies. There would also be higher income for their employees, leading to higher consumption, further investment, further employment growth, further consumption, and so on, moving right through the economy.

Not all company after tax profit is retained. In fact, about 70% is paid out in dividends with 30% added to retained earnings. We have already talked about the process that can be expected to apply to the 30% of retained earnings.
Of the other 70% paid in dividends, this will also have a multiplier effect on GDP - to the extent the recipients are Australian residents - as they spend their higher dividends on consumption of goods and services, again stimulating other sectors of the economy.
The final total impact on GDP will depend upon the size of the initial stimulus and the size of the multiplier. The OECD has estimated that Australian corporate tax is around 6% of GDP. A cut in the corporate tax rate of 5% - being a cut of one sixth - would therefore reduce corporate tax as a percentage of GDP by 1.0%.
The tax cut is equivalent to an extra 1% GDP circulating as income to somebody in the private sector – instead of being taken by the government as tax. This stimulates additional consumption and investment spending throughout the private sector as we have previously described. This increases the production of goods and services over that which would have occurred without the tax cut. This also creates more jobs in the process.
As noted earlier, an extrapolation of recent Treasury modelling would put this aggregate impact on GDP as amounting to a net increase in GDP of 1% above what GDP would otherwise have been without the tax cut stimulus.
The Australian GDP for the year to March 2016 was $1.657 trillion. As at May 2016 there were 11.9 million jobs in the Australian economy. One percent of a $1.6 trillion economy is $16 billion of extra GDP. Furthermore, this would be a $16 billion increase in the annual level of GDP over what it would have been without the tax cut.
This is a permanent $16 billion increase in the level of GDP. This would lead to extra jobs to maintain an economy at a production level which is annually $16 billion bigger than it would have been in the "no tax cut" case.
A permanent 1% increase in Australian GDP means more jobs. How many additional jobs might we expect? When the economy grows in output, it tends to also grow in productivity. The long term growth rate in productivity would appear to be around 1.5% per annum. This means that we need 1.5% fewer workers each year to produce the same amount of GDP.
Over 10 years, this means we need around 16% fewer workers to produce the same level of output. Over 10 years then, a 1% increase in GDP would therefore produce around a 0.84% increase in the number of jobs. Right now there are 11.9 million jobs in the Australian economy so an extra 0.84% would mean an extra 99,960 jobs. Let us just round it up and say around 100,000 extra jobs.

Statistical Testing
Evidence of the relationship between after tax earnings of Australian corporations and GDP is hiding in plain sight. It is commonly said that the stock market is the leading indicator of the economy. When the stock market is strong the economy tends to be strong in the following period. When the stock market is weak, the economy tends to be weak in the following period.
Our observation is that sustained rises in the stock market are caused by sustained rises in the earnings of companies that are traded in the stock market. These earnings are by definition the after tax earnings of corporations listed in the equities market. Their earnings are therefore publicly available.
We test one of those publically available series of earnings for corporations that are traded on the Australian equities market. We compare changes in those after tax earnings to changes in Australian GDP. We find there is a strong relationship between the real after tax earnings of companies listed in the Australian equities market and real trend GDP.
The data sample we use is the three decade period from the third quarter of 1993 up to and including the first quarter of 2016. Our testing suggests the relationship between growth in after tax corporate earnings and GDP growth is very strong. The T statistic for this relationship is 3.0. This means that the chance of this estimated relationship not being a real relationship and simply being a spurious artefact of the data is only around 3 chances in 1,000.
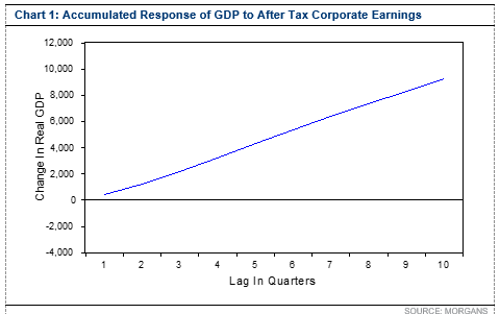
Impulse Diagrams
In Chart 1, Chart 2 and Chart 3, we show a form of statistical examination called the impulse diagram. Under this procedure, we measure the change of one variable in response to a one standard error change in another variable. In Chart 1, we see that a one standard error change in real after tax corporate earnings leads to an increase in real GDP. Then in further charts we look at how this process occurs by way of increases in private investment.
In Chart 2, we see the change in real private fixed capital investment that occurs as a result of a one standard error increase in Australian real after tax corporate earnings. We can see how an increase in after tax corporate earnings leads to a gradual increase in private fixed capital investment.
In Chart 3, we see the change in employment that occurs as a result of a one standard error increase in Australian real private fixed capital investment. We can see from Chart 3 the enormously powerful and driving force that private fixed capital investment has as a source of jobs growth in the Australian economy.
These three charts drawn from the actual data of the Australian economy demonstrate that after tax corporate profits lead to private fixed capital investment. Private fixed capital investment then leads to job creation.
Conclusion
We have demonstrated that rises in after tax corporate earnings lead to rises in GDP. A cut in the company tax rate will lead to a rise in after tax corporate earnings. A cut in the corporate tax rate will then lead to a rise in GDP. This relationship can be demonstrated both theoretically and statistically.
Recently some economists have been very publicly unable to find a relationship between corporate tax cuts and growth in GDP. It took hundreds of years to discover Australia. This does not mean that Australia did not exist. It just means that it was very difficult for some people to find.
The information contained in this report is provided to you by Morgans Financial Limited as general advice only, and is made without consideration of an individual’s relevant personal circumstances. Morgans Financial Limited ABN 49 010 669 726, its related bodies corporate, directors and officers, employees, authorised representatives and agents (“Morgans”) do not accept any liability for any loss or damage arising from or in connection with any action taken or not taken on the basis of information contained in this report, or for any errors or omissions contained within. It is recommended that any persons who wish to act upon this report consult with their Morgans investment adviser before doing so. Those acting upon such information without advice do so entirely at their own risk.
This report was prepared as private communication to clients of Morgans and is not intended for public circulation, publication or for use by any third party. The contents of this report may not be reproduced in whole or in part without the prior written consent of Morgans. While this report is based on information from sources which Morgans believes are reliable, its accuracy and completeness cannot be guaranteed. Any opinions expressed reflect Morgans judgement at this date and are subject to change. Morgans is under no obligation to provide revised assessments in the event of changed circumstances. This report does not constitute an offer or invitation to purchase any securities and should not be relied upon in connection with any contract or commitment whatsoever

 reddit this
 Seed Newsvine
 StumbleUpon
