There is a lot of pessimism about the CBD office market in Brisbane at present but is all of it warranted? A lot depends on how you think about the numbers. Here are three graphs dealing with Brisbane markets, all derived from the same data set provided by the PCA, which paint very different pictures of what's going on.
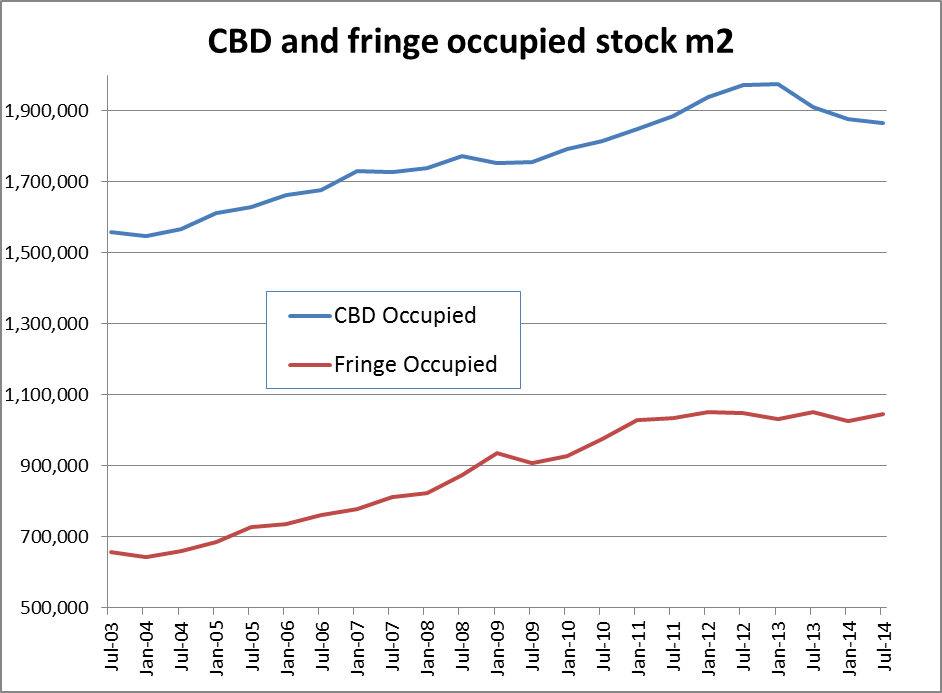
Let's start with the more positive view of things. This graph shows the total occupied space in CBD and city fringe office markets over time. Occupied space simply takes the total stock of space, and subtracts the total vacancies. It's the sort of analysis suited to the people who don't care if the glass is half full or half empty… they only care about how much volume is in the glass, irrespective of how big or small the glass is.
Advertisement
What this indicates is a fairly resilient market. The GFC had almost no impact on occupied space - probably thanks mainly to the mining sector and a rapidly growing public sector at the time, particularly the 'admin' functions of government which tended to be housed in the CBD, as opposed to 'frontline' public servants (eg teachers, nurses, police etc) who aren't. Since the downturn in the resources sector from 2013 combined with the Newman State government pruning its staff numbers to more sustainable levels, occupied space in the CBD shrank somewhat from early 2013. But in the broad scheme of things, this picture is still relatively healthy.
The city fringe market, which was home to a large number of resource based companies and businesses who derived a healthy living from them, has by contrast not suffered much of a contraction. It may have stopped expanding but unlike the CBD, it hasn't been shrinking.
Still, looking at the figures this way, you would conclude that both markets are generally trending up, with the CBD showing some relatively minor deterioration in recent years but nothing to suggest major alarm bells.
So why all the pessimism? Probably because the industry – along with the PCA who produce the figures – have traditionally focussed on the vacancies. This is the sort of analysis that by its nature appeals to the glass half empty pessimists. They're not focussed on how much is actually in the glass, they're worried that they've got a very big glass which isn't as full as they'd like it to be. If anyone brings an even bigger glass and the same contents are poured into it, they become desperately worried.
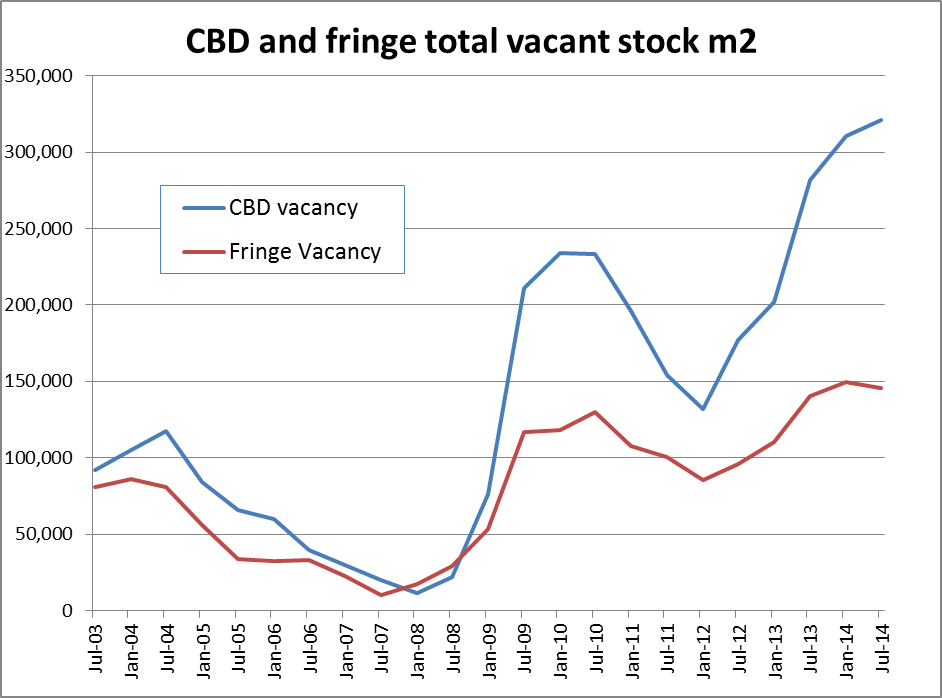
This graph shows total vacancies in CBD and fringe markets over time. Little wonder people are feeling a bit glum. Office vacancies, on the back of some shrinking in occupied space plus the addition of some stock, are approaching 350,000 square metres. That's like six Waterfront Places of space, all empty (but not of the same grade). Not only that, but there is more stock in production, which will mean bigger glasses and more empty space. The city fringe has fared relatively better. CBD vacancies have more than trebled since 2003 but fringe vacancies have only slightly more than doubled. Not a huge compensation, but maybe some relief to city fringe owners. The contrast with the very tight market conditions in 2008 is stark however, and the growth in vacancies since then, dramatic.
Advertisement
Of course the real story is in what these dynamics are doing to rents. Incentives are rising and real rents are falling. Some of the sublease deals doing the rounds in Brisbane at the moment are said to be 'very attractive' – which is industry-speak for dirt cheap. Certainly well below replacement cost. Tenants can exploit the current market and move up a grade or two of space but still pay the same rent. Low grade office space will be the hardest of all to lease, and owners will explore alternative options – as they have been doing in the form of hotel or apartment conversions. (Why haven't more explored education related options, or even retirement living options? If they have, they've kept it quiet).
The city fringe markets I'm told have fared better in terms of rents and aren't exposed to the same levels of discounting. It's reaching the point where the cost of high quality space in city fringe locations isn't much cheaper any more than sublease CBD space. My guess is that's going to discourage any further major moves from CBD to fringe locations, for a while at least.
The third chart, also drawn from the same data set, shows a very different picture altogether. This is the chart for people who like to think about the larger picture. This chart shows the CBD's share of the combined occupied space of both the CBD and fringe. In other words, combine the volumes in both glasses and work out who has more.
Discuss in our Forums
See what other readers are saying about this article!
Click here to read & post comments.
2 posts so far.

 reddit this
 Seed Newsvine
 StumbleUpon