Inherent in IPCC climate change projections are continuous trends toward mean global temperatures of 1.8 to 3.6 degrees C by 2100, depending on emission scenarios, as adopted in the Stern and Garnaut reports, giving an impression as if mitigation and/or adaptation can be undertaken at any economically or politically chosen time over the next several decades.
Unfortunately this is not the case.
Studies of the atmosphere-ocean-cryosphere (polar ice) system, based on evidence from ice cores, deep sea sediments, coral reefs, cave deposits and other proxies, demonstrate abrupt changes between climate states over periods as short as a few centuries, decades and even few years.
Advertisement
Central to such changes is the radiative forcing state of the atmosphere, namely the positive or negative balance between incoming energy flow (warming) and outgoing energy flow (cooling) associated with solar insolation, surface albedo, greenhouse gas levels (water vapour, CO2, methane, N2O, halocarbons, ozone) and aerosols (SO2, dust, sooth). Since the 18th century radiative forcing rose by near to 3.2 Watt/m2, predominantly due to emission of over 320 billion tons of carbon (GtC) and deforestation. Temperatures, ice melt and sea level rise lag behind radiative forcing by unspecified periods.
Interglacial periods (~410, 330, 240, 140 kyr) similar to the current Holocene (11.7 thousand years-ago [kyr] to the present) provide essential benchmarks for the behaviour of the atmosphere under rising radiative forcings (Figure 1 and 2) [1], [2].
Previous interglacial periods were up to 0.7 degrees C warmer than the mean value of the Holocene (Figure 2). For example a temperature rise at the Eemian, ~140 kyr ago was associated with sea level rise of about 5-7 meters relative to the present [5], setting a minimum for future sea level rise under current climate conditions.
Based on the study of ice cores and deep sea sediments, shifts between glacial and interglacial climates during the last 800,000 years (800 kyr) typically involved atmospheric energy changes of ~6.5+/1.5 Watt/m2, which is translated to ~5.0+/-1.0 degrees C (Figure 1). This defines a relation between temperature and atmosphere energy level of approximately 0.75 degree C per 1 Watt/m2 (Hansen et al., 2008 [1], 2011 [2]).
The 3.2 Watt/m2 rise since the 18th century, in the absence of SO2 aerosols, commits the climate to near 4 degrees C rise, exceeding previous interglacial periods (Figure 1). Such atmospheric energy levels can be compared with conditions which existed in the early to mid Pliocene (5.3 – 2.6 million years ago; <400 ppm CO2; T ~ +2 to +4 degrees C; sea level +25+/-12 meters higher than the Holocene) (Figure 2) and the mid-Miocene (~16 million years ago; <650 ppm CO2; ~4 degrees C; sea level +40 meters relative to the Holocene).
The expression of climate change through a series of extreme weather events around the globe, including heat waves, increased evaporation and precipitation and intensifying cyclone cells, remains little understood by the public. Lenton et al. 2008 state [3]: “Society may be lulled into a false sense of security by smooth projections of global change. Our synthesis of present knowledge suggests that a variety of tipping elements could reach their critical point within this century under anthropogenic climate change.” (Figure 3)
Advertisement
While the timing of tipping points can not be determined, such may be preceded by lulls, as indicated by Dakos et al., 2008 [4] (Figure 4): “…we analyze eight ancient abrupt climate shifts and show that they were all preceded by a characteristic slowing down of the fluctuations starting well before the actual shift … our results imply independent empirical evidence for the idea that past abrupt shifts were associated with the passing of critical thresholds.”
The amplifying feedback mechanism of polar ice melt is the so-called albedo-flip effect, where loss of reflection by melted ice is compounded by infrared absorption by open water, a process currently taking place in the Arctic Sea, as reported by Hansen et al. [1], [2]: “… amplifying feedbacks make ice sheet disintegration necessarily highly non-linear. In a non-linear problem, the most relevant number for projecting sea level rise is the doubling time for the rate of mass loss. Hansen (2007) suggested that a 10-year doubling time was plausible, pointing out that such a doubling time from a base of 1 mm per year ice sheet contribution to sea level in the decade 2005-2015 would lead to a cumulative 5 m sea level rise by 2095.”
Satellite studies of Greenland and Antarctic ice melt rates by Velicogna, 2009 [6] and Rignot and Velicogna, 2011 (cited in [2]), who indicate acceleration of Antarctic and Greenland ice melt rates, forming major contribution for sea level rise.
It is not generally realized that, through rising atmospheric CO2 levels since ~8000 years ago due to fires and deforestation, and rising methane since ~5000 years due to rice cultivation and animal husbandry, civilization has subconsciously postponed climate cooling toward the next ice age by near-2.7 degrees Celsius [7]. Judicious science-based injection of greenhouse gases into the atmosphere would have been able to prolong interglacial Holocene conditions, justifying the term “Homo sapiens”.
Instead, since the mid 18th century, uncontrolled release of fossil carbon from hundreds of million years-old fossil biospheres at <2 ppm/year, a rate unprecedented in geologic history (barring major volcanism and asteroid impacts), is pushing mean global temperatures toward climate conditions of millions of years ago when tropical conditions dominated much of the Earth and large parts of the continents were covered by seas.
[1] http://www.columbia.edu/~jeh1/2008/TargetCO2_20080407.pdf
[2] http://www.columbia.edu/~jeh1/mailings/2011/20110118_MilankovicPaper.pdf; http://climateprogress.org/2011/01/20/hansen-sato-climate-tipping-point-multi-meter-sea-level-rise/
[3] Lenton et al. 2008.
http://researchpages.net/esmg/people/tim-lenton/tipping-points/
[4] Dakos et al.,2008. http://www.pnas.org/content/105/38/14308
[5] http://eis.bris.ac.uk/~glyms/Siddalletalbook2005.pdf
[6] http://www.agu.org/journals/ABS/2009/2009GL040222.shtml
[7]http://www.ingentaconnect.com/content/klu/clim/2003/00000061/00000003/05145667 , http://www.springerlink.com/content/p80k8m717qm01710/
[8] http://www.ipcc.ch/publications_and_data/publications_and_data_reports.shtml
[9] http://www.sciencemag.org/content/326/5958/1394.abstract
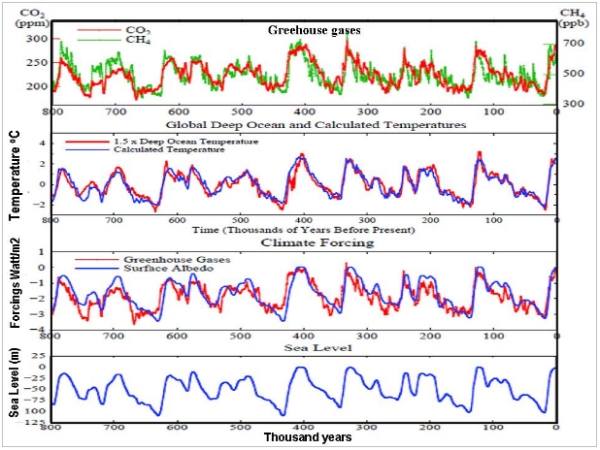
Figure 1.
CO2, methane, temperatures based on deep ocean measurements, calculated temperatures, greenhouse gas forcing, surface albedo and sea level changes over the past 800,000 years. From Hansen and Sato, 2011 [2].

Figure 2
Past global temperatures relative to mean Holocene temperature, based on ocean core records, with temperature change amplified by factor 1.5 (relative to Vostok-based estimates). Red arrow in upper diagram indicates temperature rise since 1750 consistent with the rise in atmospheric energy levels at 1.7 Watt/m2, indicating a committed rise of +1.2oC, or ~ +2.4 oC rise without aerosol masking effects.
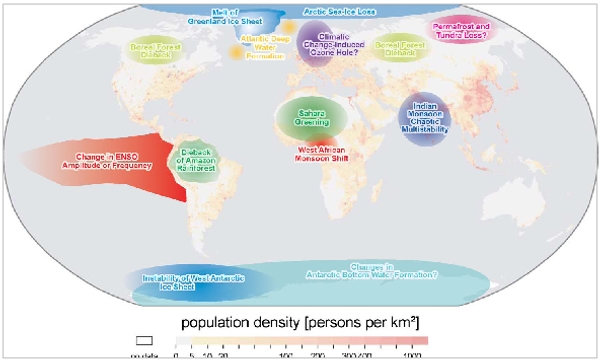
Figure 3.
Map of potential tipping elements in the climate system, overlain on global population density. Subsystems indicated could exhibit threshold-type behaviour in response to anthropogenic climate forcing, where a small perturbation at a critical point qualitatively alters the future fate of the system (Lenton et al. 2008 [3]). http://researchpages.net/esmg/people/tim-lenton/tipping-points/
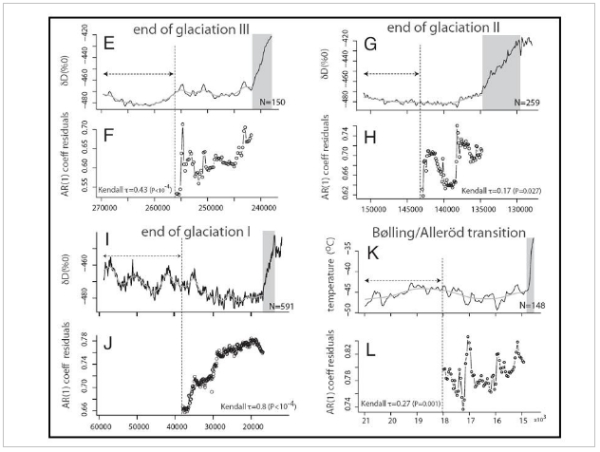
Figure 4
Reconstructed time series of abrupt climate shifts in the past. The arrows mark the width of the moving window used to compute slowness. The smooth grey line through the time series is the Gaussian kernel function used to filter out slow trends. Dakos et al.,2008 [4]. http://www.pnas.org/content/105/38/14308

 reddit this
 Seed Newsvine
 StumbleUpon